The ABC-HuMi Table provides some functionality for easier browsing.
By clicking on the BGC ID entry of a row you open the detailed results.

1. By using the group button at the top of the table, you can switch between using all BGCs, grouped by gene cluster families or grouped by gene cluster clans.
2. By clicking in the Show X rows button you can change how many rows are shown per page.
3. By clicking in the Column visibility button you can change which columns of the table are shown and which ones are hidden.
4. By clicking on the arrows besides the column titles you can sort the table ascending or descending in this specific column.
5. You can use the text fields below the column titles to filter the table in this specific column. You can search for multiple terms by using a Comma (,), e.g.: "Gut,Oral". For columns with numerical content you can also add the symbols for "smaller than" (<), "greater than" (>), "smaller or equal than" (<=) or, "greater or equal than" (>=) in before a number to filter accordingly.
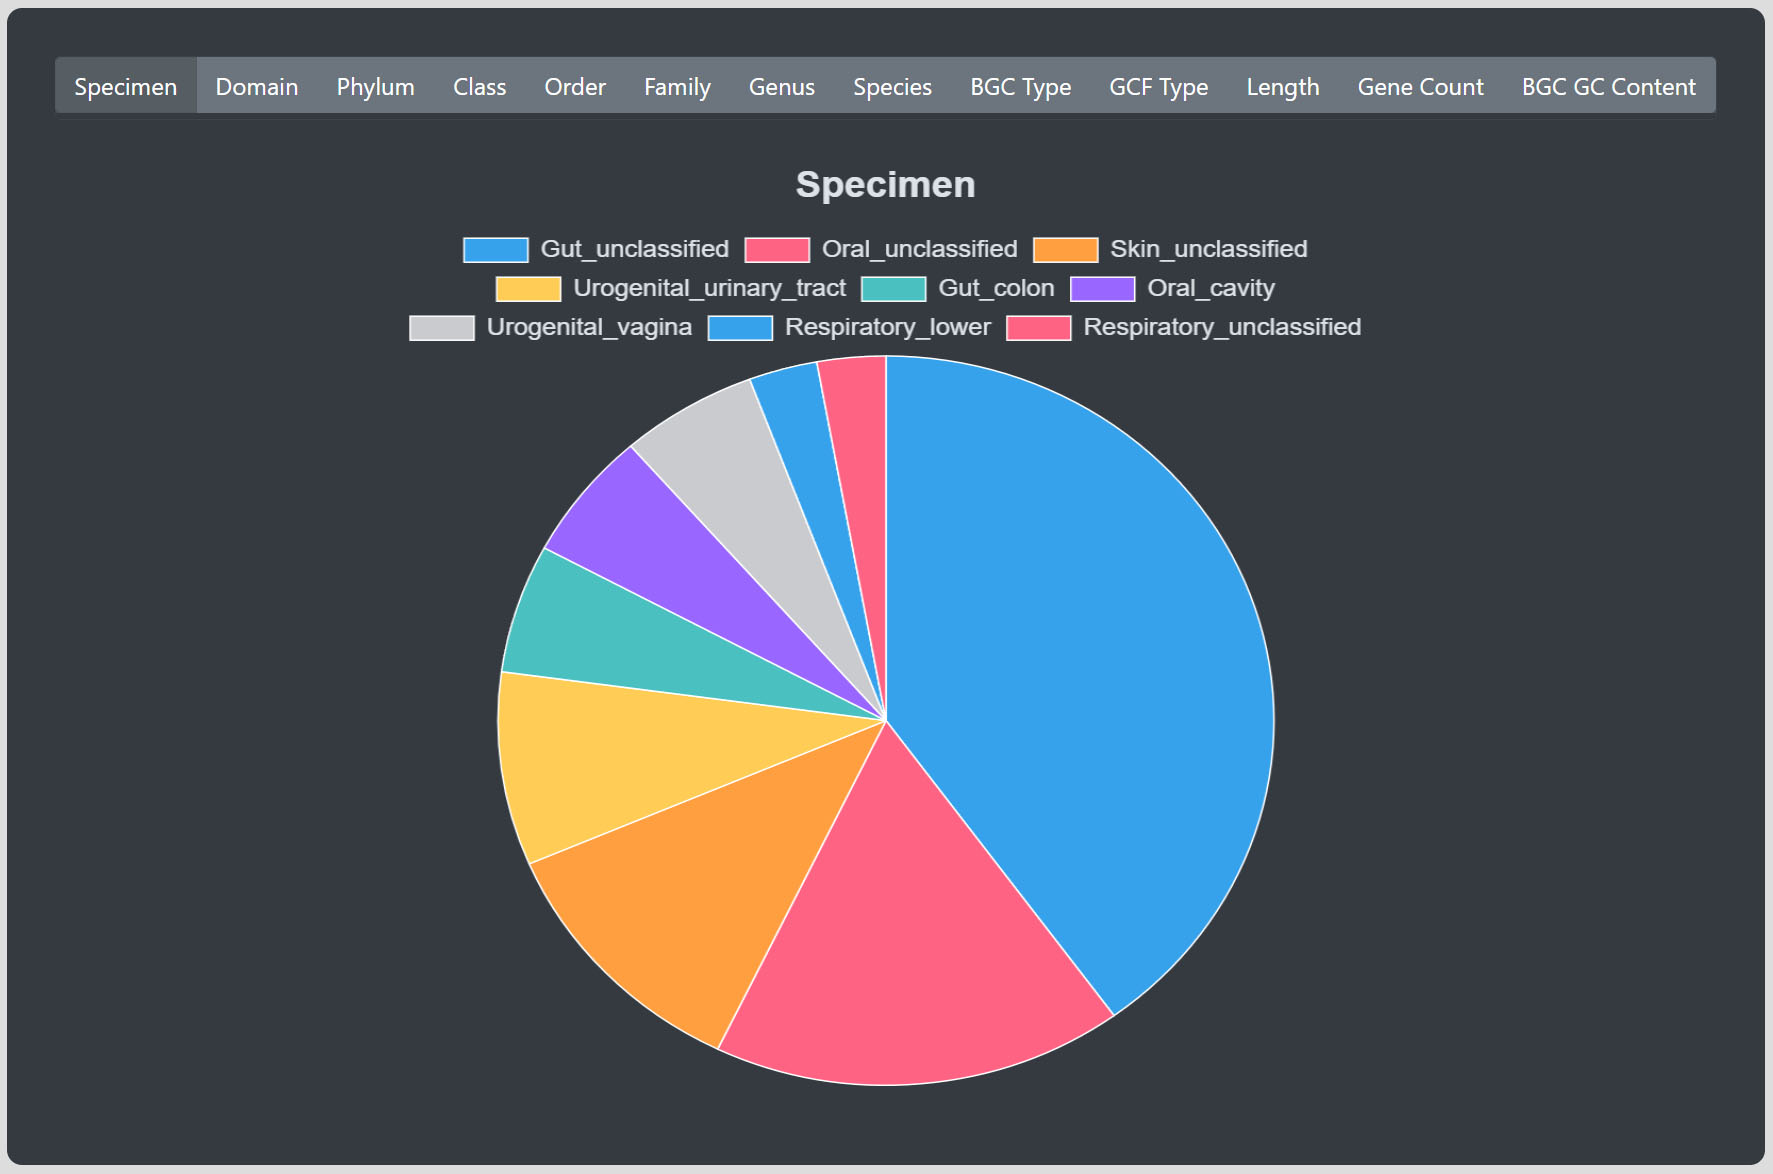
Below the table you can select different kind of plots which are representing the currently filtered table data.
The Query Page allows you to seamlessly search for custom genes or entire BGCs.
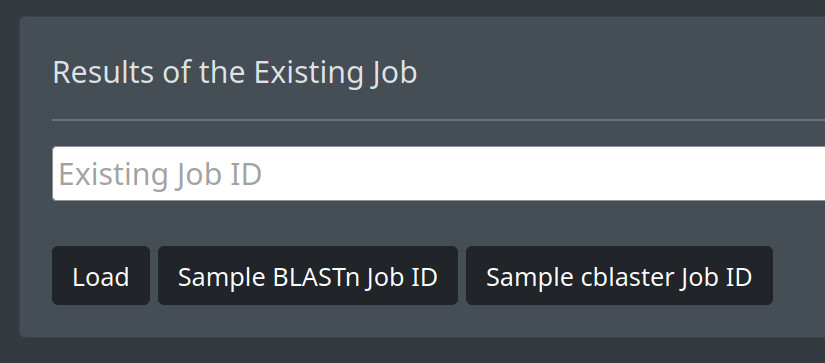
If you already have started a search and want to open it again, you can enter your job ID in text box and use the Load button. You can also enter an example job ID by using the corresponding buttons.
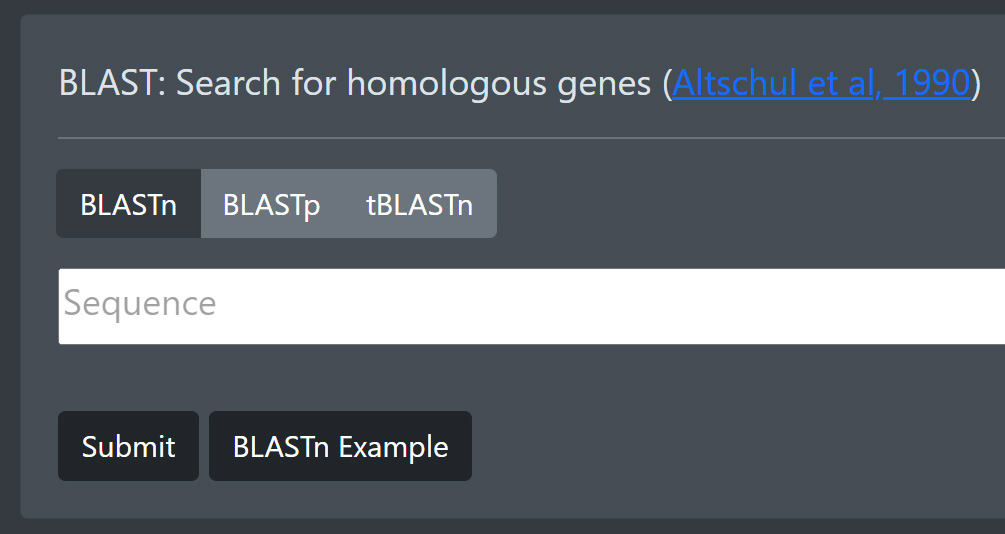
If you want to search using a nucleotide or protein sequence, you can use BLAST by entering your sequence in the Sequence text field. Use BLASTn for a Nucleotide to Nucleotide comparison search, BLASTp for a Protein to Protein comparison search and tBLASTn for a Protein to translated Protein search. You can use the Example Button to enter an example sequence corresponding to the currently active BLAST version.
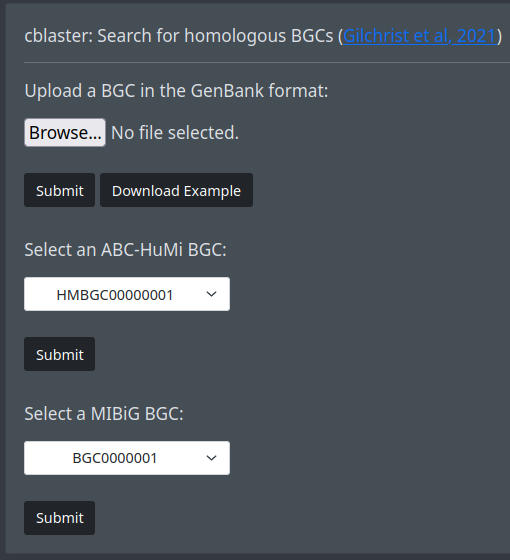
If you want to search using a gbk file, you can use cblaster. Upload a file the Browse button and submit it. You can download an example gbk file via the Download Example button. Alternatively, you can select a BGC from the ABC-HuMi or the MIBiG list and start the search with the corresponding Submit button
The Query Page allows you to visually comprehend BGC similarity networks.
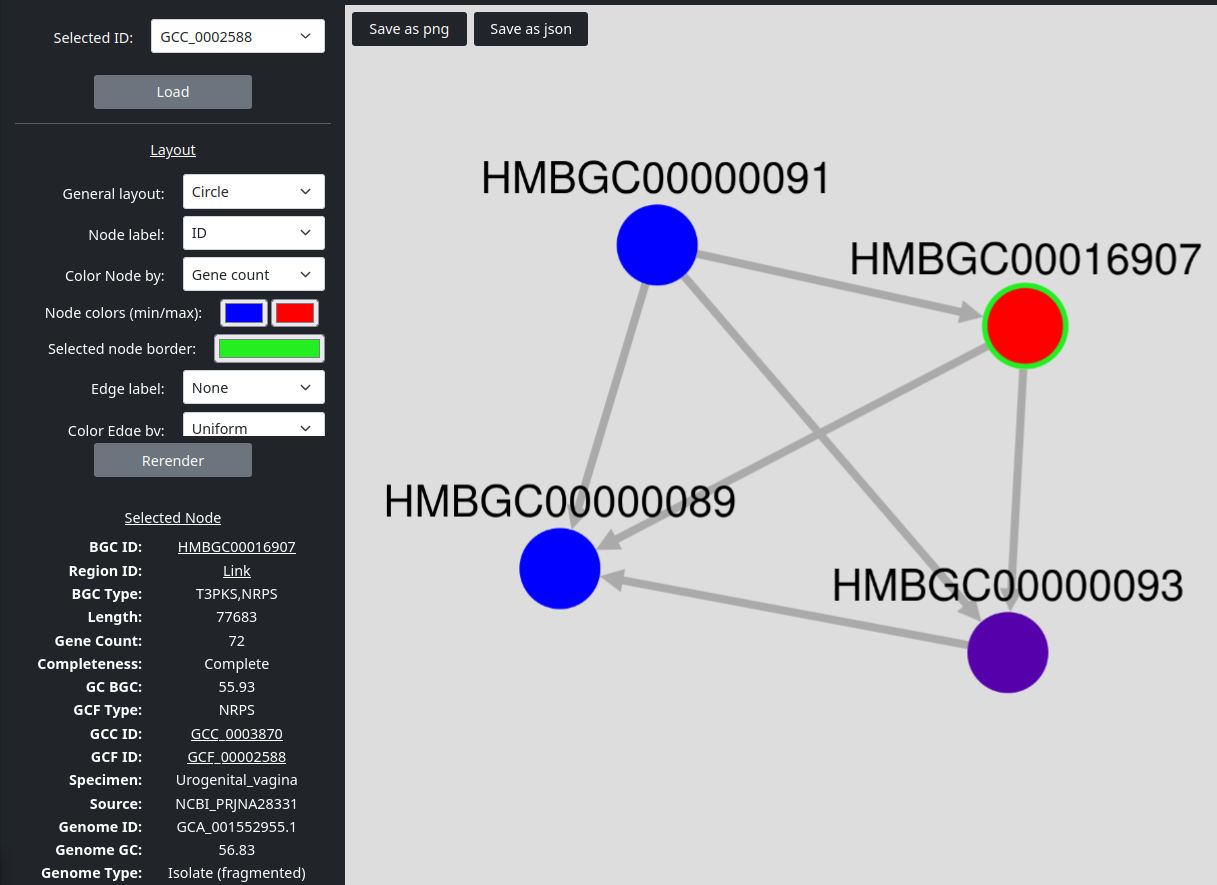
You can select an ID in the upper left dropdown box which also provides an search field. To load the selected ID click on the Load button. You can also use the Cytoscape button on the GCF and GCC tables of the Browse page.
You can freely adjust the graph by dragging the nodes with the left mouse button, zooming via the middle mouse button or by dragging the whole graph clicking and holding the left mouse button in a free space.
To adjust the layout, you have various options in the Layout section on the left sidebar. You apply them by clicking on the Rerender button. The General layout dropdown provides different styles of general node ordering. You can also change the labels on the nodes and edges and color them by different parameters. If you color the nodes or edges using a number value, you can select two colors. The first color will be the color of the node or edge with the lowest value and the second color will be the color of the node or edge with the highest value. All other nodes or edges are colored in between these given colors according to distance to the minimum and maximum value. If the chosen coloring is an text value, the provided colors are assigned according to the corresponding labels.
If you select a node or edge by clicking on them, you can see its corresponding values in the lower left corner.
You can download an image of the currently shown graph via the Save as png button or its containing data via the Save as json button.