 miRTargetLink Human
Manual
This short manual takes you through the functions of miRTargetLink with screenshots explaining every step.
Index
1 Single microRNA or Gene queries
To execute a query for a single microRNA or gene expand the searchfield on the right, enter a microRNA- or gene name and click search.
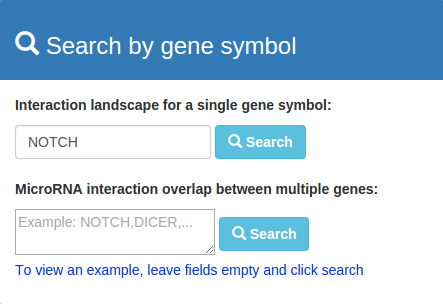
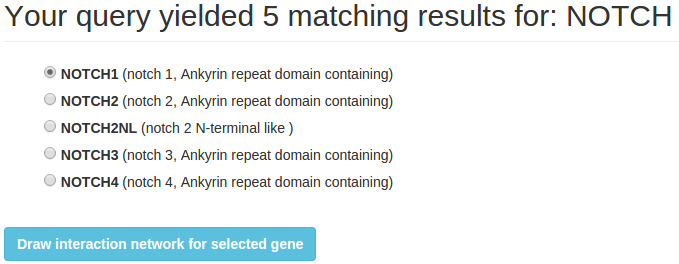
By submitting the query you will either be directed to the result page, or directly to the network page when there is only one result.
On the result page select the right microRNA or gene and click "Draw interaction network for selected gene/microRNA".
2 Multiple queries
miRTargetLink offers the possibility to draw networks for multiple microRNAs or genes as well. To do so enter multiple queries
separated by commas in one of the textareas in the panels on the right.
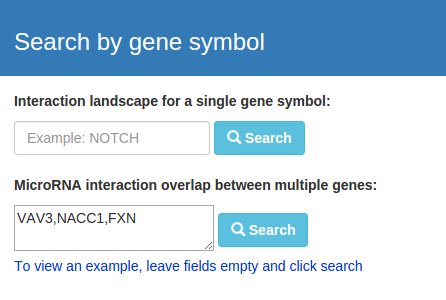
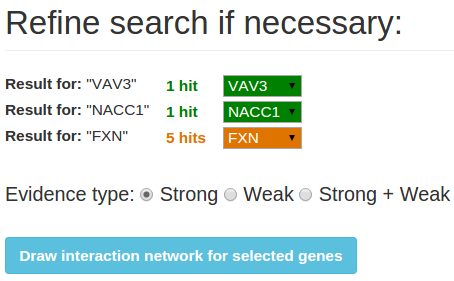
By submitting the queries you will be directed to a result page where you can refine your search by selecting the microRNAs or
genes of your choice using the dropdown menus. Select one or more evidence types to include in the graph with the radio buttons, by default
'strong' is selected. After selecting the right queries and evidence types click "Draw interaction network for selected
genes/microRNAs".
3 Network view
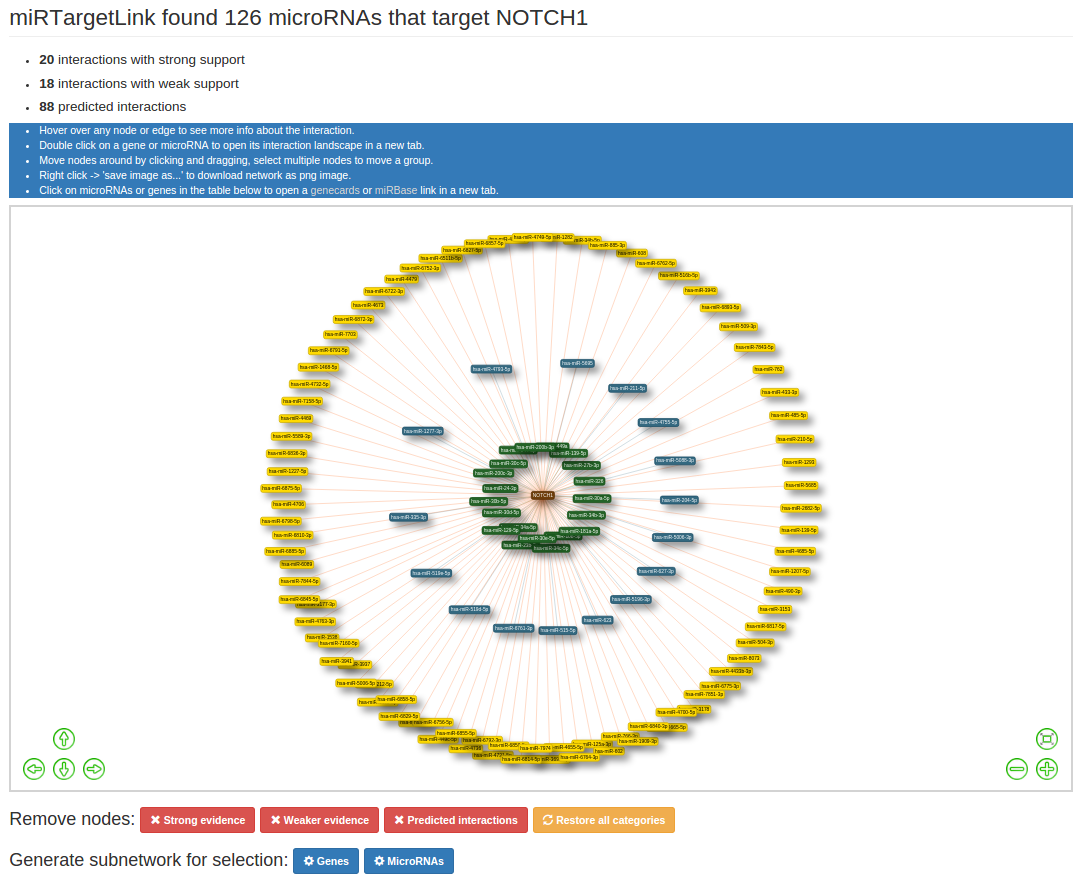
After executing your queries you will be directed to the network page. On the top you will find specific information about the results. For both single- and multi query networks there will be information about the types of evidence that back up the interactions. The evidence catagories are "Strong", "Weak" and "Predicted".
- Strong: backed up by strong experimental methods like 'reporter gene assay' (strong overrules weak if both applicable to interaction)
- Weak: backed up by weaker experimental evidence like 'microarrays' (weak overrules predicted if both applicable to interaction)
- Predicted: interaction not backed up by experimental evidence but predicted by at least one of the prediction algorithms
For multiple queries experimentally validated interactions from both the strong and weak evidence category will be
included in the graph, predicted interactions are excluded in this version of miRTargetLink.
There is always the possibility to re-arrange the network by selecting one or more nodes and moving them around (click+hold and drag). This might be particularly
helpful if you want to download a clear image of the network for display purposes.
3.1 Data interaction
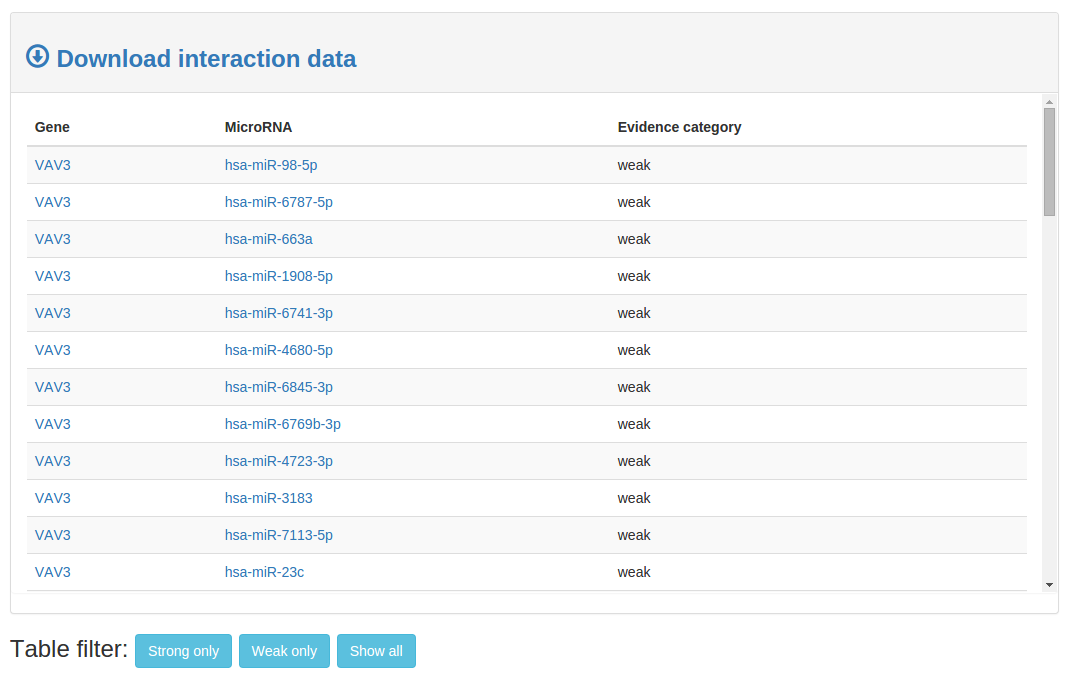
On the bottom of a network page the network data is displayed in an interactive table. Click any name
to open a miRBase or genecards page for that specific microRNA/gene. To filter out certain evidence categories use the filter buttons below the table. Click 'Download interaction data to recieve the data in
comma separated format.
3.2 Network features
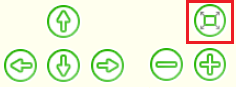
In the network view you can move the network around by dragging it with the mouse or using the arrow buttons. Zoom in and out by using the scroll wheel or the +/- buttons. Use the 'center' button (see red box in image below) to re-center the network.
For single query networks, the length of the edges and the colour of the nodes are an indication for the evidence
catagorie.
- Strong: shortest edges, node colour is (green)
- Weak: second shortest edges, node colour is (blue)
- Predicted: longest edges, node colour is (yellow)
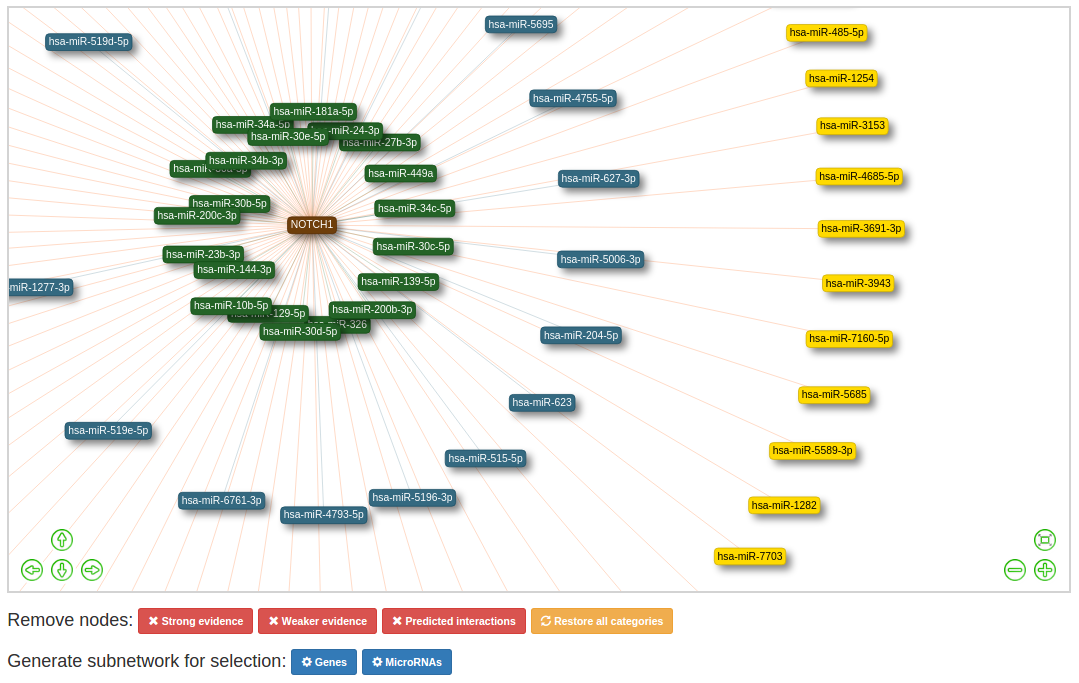
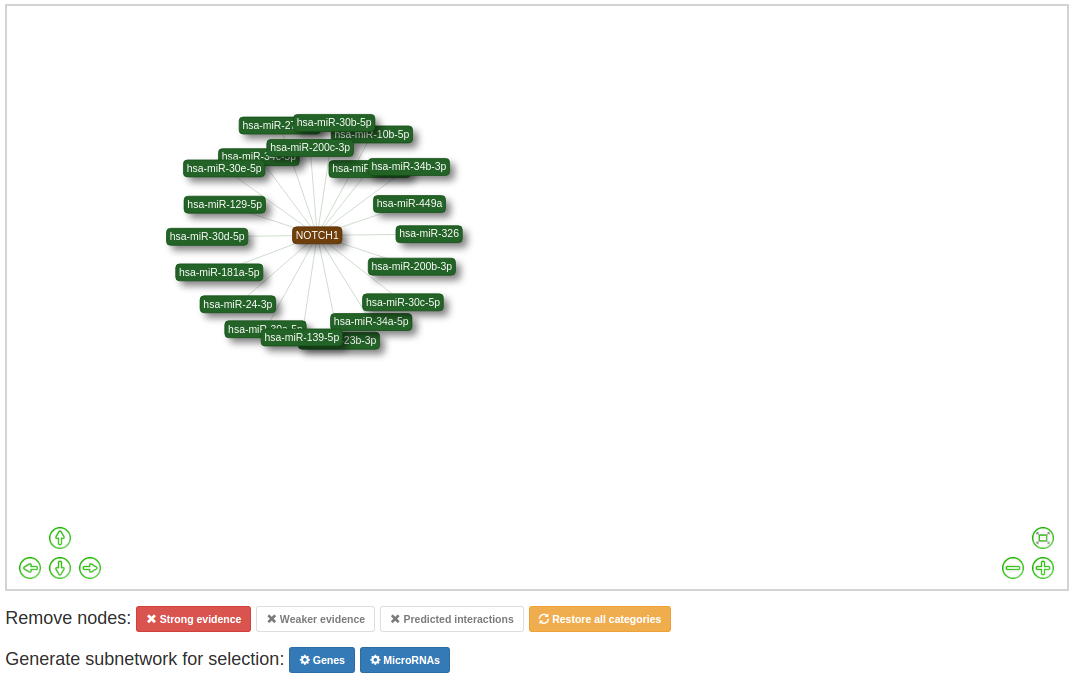
Use the buttons below the network to filter out specific catagories. To restore the original network click 'Restore all categories network'.
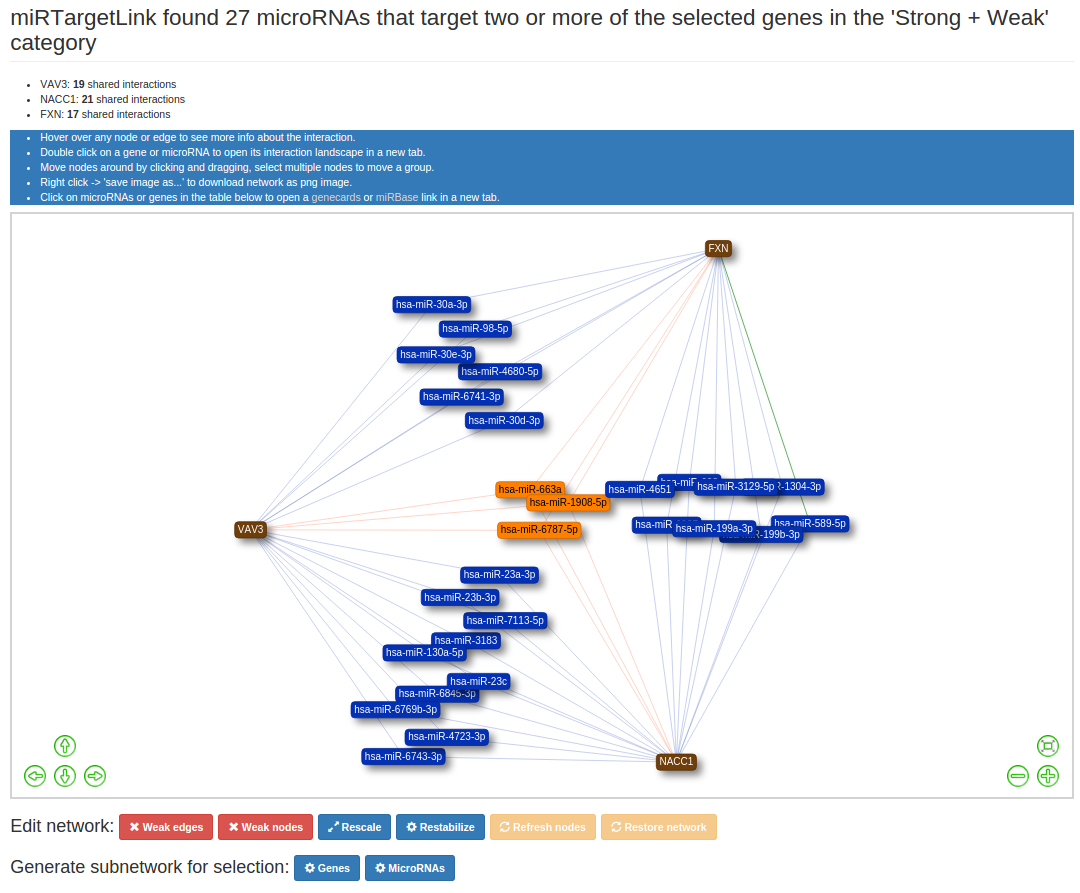
For networks with multiple query nodes, The colour of the nodes and edges is an indication for the amount of known interactions
the node is involved in.
- More than 2 interactions: nodes and edges coloured Orange
- 2 interactions: nodes and edges coloured Blue
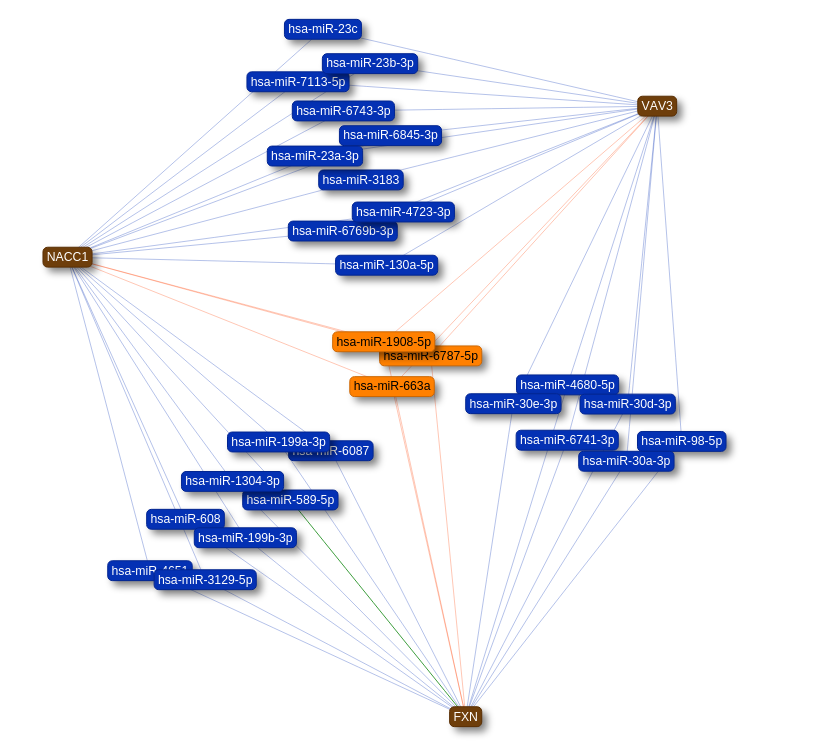
In this network view you can remove nodes and edges with the interaction buttons below the network.
Undo your changes to the network by clicking 'Restore network' which reloads the original network.
Generate a subnetwork by selecting the nodes of interest and clicking 'Generate network for selected genes/microRNAs'.
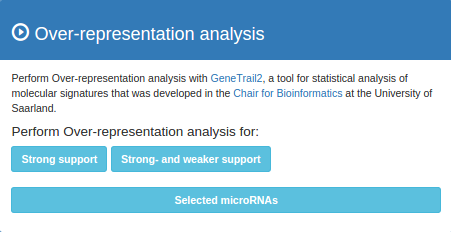
3.3 Over-representation analysis
Over-representation analysis (ORA) can be performed with GeneTrail2. To do so click the buttons in the ORA panel on the right. With single queries you can choose the evidence type that you want to include in the ORA. With multiple queries ORA can be performed on either the complete overlap set or the set of nodes that are currently visible in the network (e.g. after removing weak links). In both cases there is the option to perform ORA on a set of genes/microRNAs that is selected in the network.
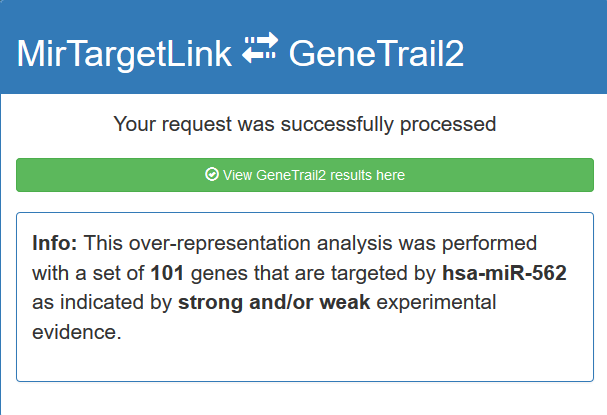
By executing an ORA you will be directed to a loading screen. As soon as the ORA is completed you will be presented with a personal link
to GeneTrail2.
4 F.A.Q
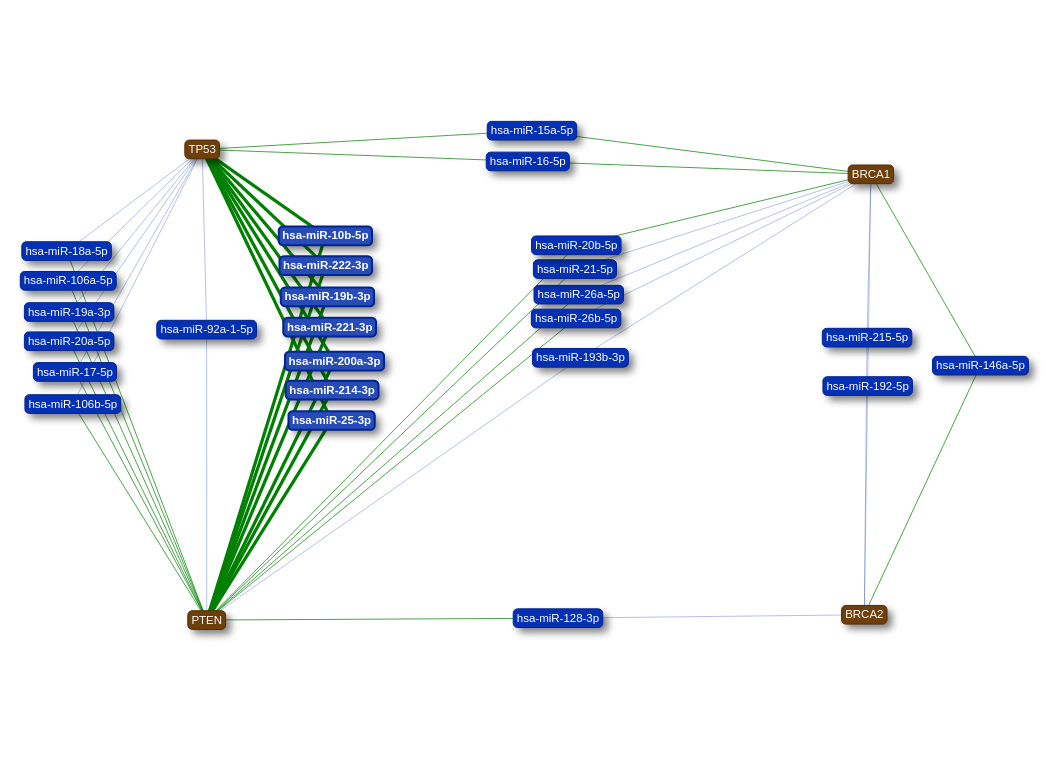
Q: Why am I seeing green edges as well when I generate a network in the weak category?
A: Interactions for which there is strong evidence always overrule the weaker evidence if present. In this case miRTargetLink shows you a green edge as an indication that there is strong evidence for that interaction as well as weaker evidence.
Q: Why are some nodes still orange after removing weak edges eventhough they have two outgoing edges?
A: By default the nodes keep their original colour because it indicates that the node is part of a bigger network, which is information the user might want to have included. To update the node colour click 'Refresh nodes'.

To view an example, leave fields empty and click search
To view an example, leave fields empty and click search