
IMOTA – Interactive Multi-Omics-Tissue Atlas
This project combines and visualizes multiple databases to simplify the process of finding relations between the omics in 19 tissues.
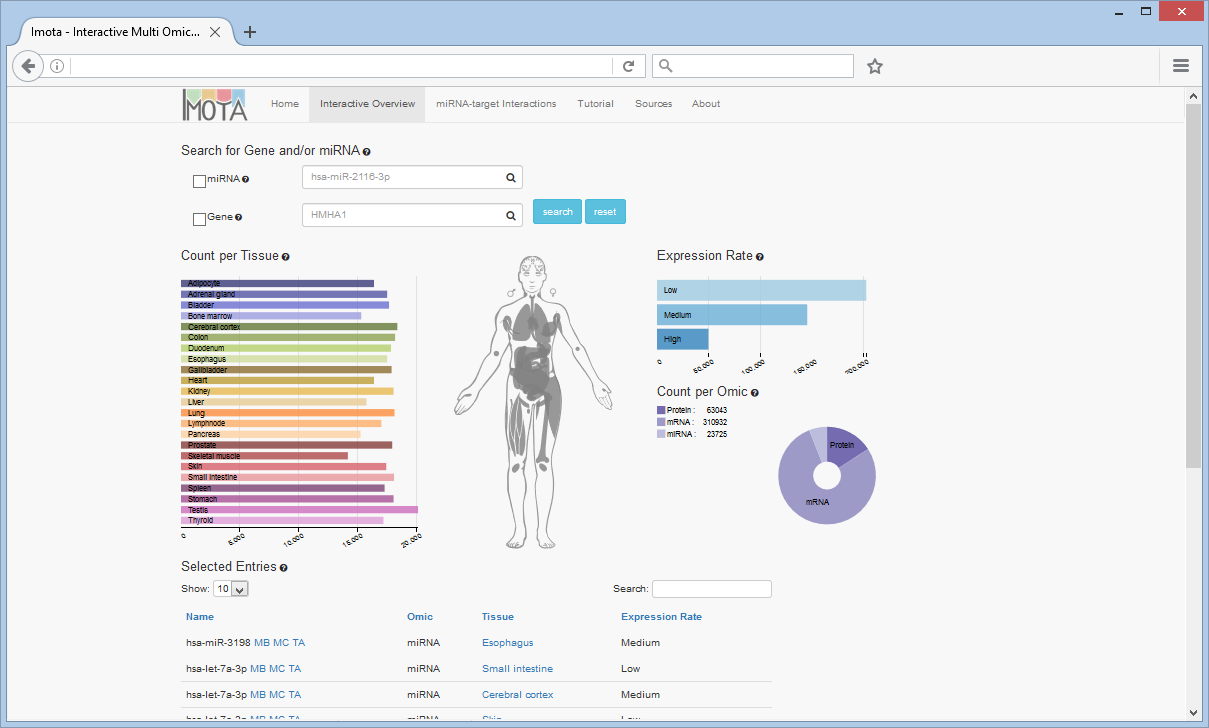
Interactive Overview
On the overview page you can interactively filter the data through interaction with the charts and the search fields.
Filter by Chart
The Expression Rate bar chart displays how many entries have a low, medium or high expression rate. The Count per Omic pie chart visualizes the proportional count of the individual omics. The Count per Tissue bar chart resolves omic counts per tissue according to the user selection.
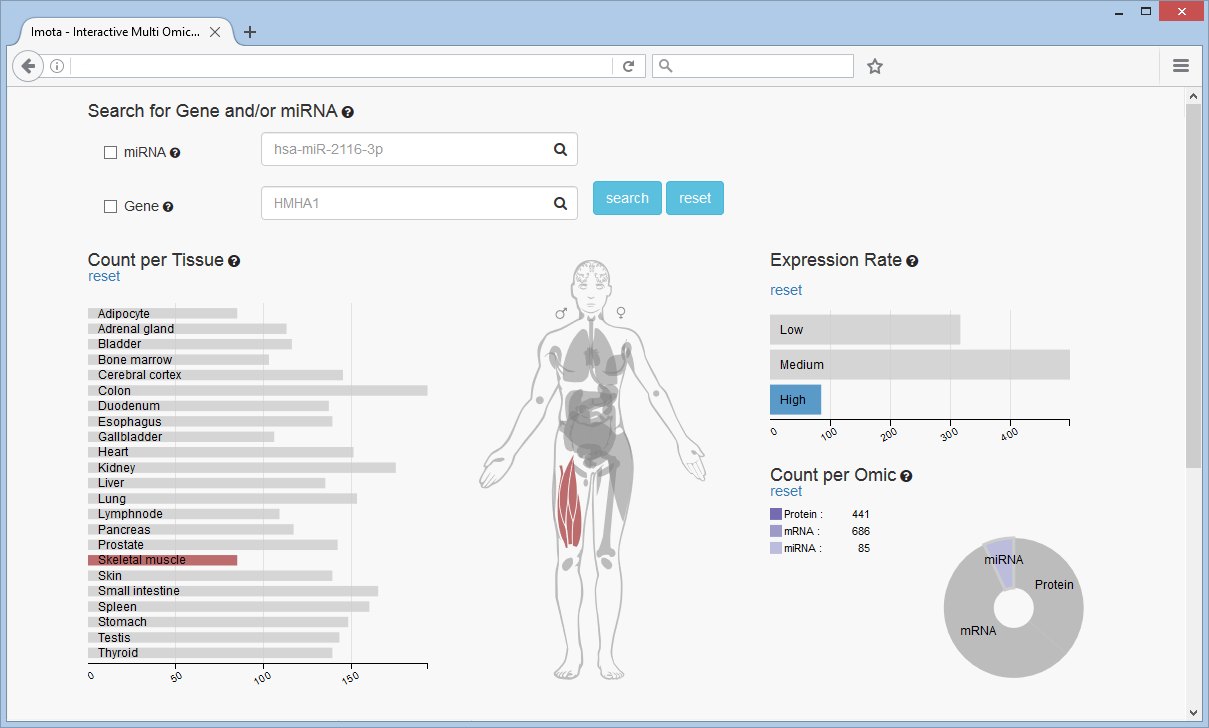
Filter Example
In this example miRNAs with a high expression rate in the skeletal muscle tissue were selected, revealing 85 miRNAs (Count per Omic chart).
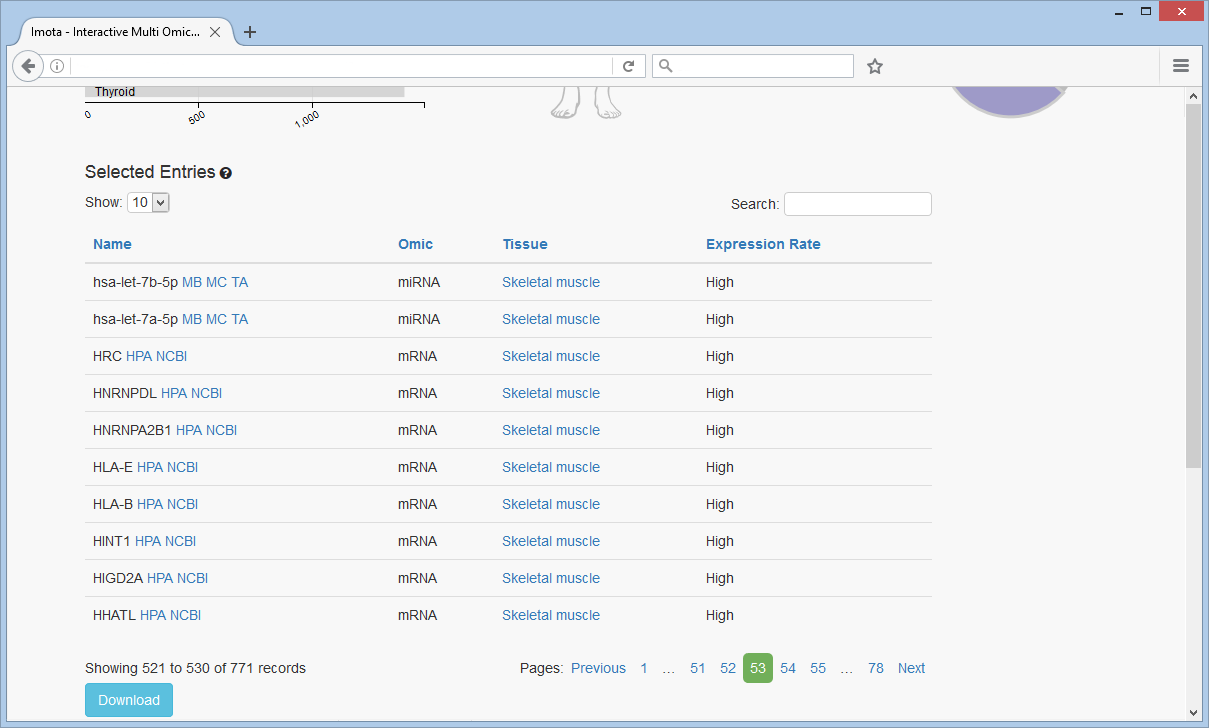
Overview Table
An overview of the selected entires is provided in tabular form and can be downloaded in CSV-format. Links to the corresponding sources are provided. Sorting and searching within the table is also supported.
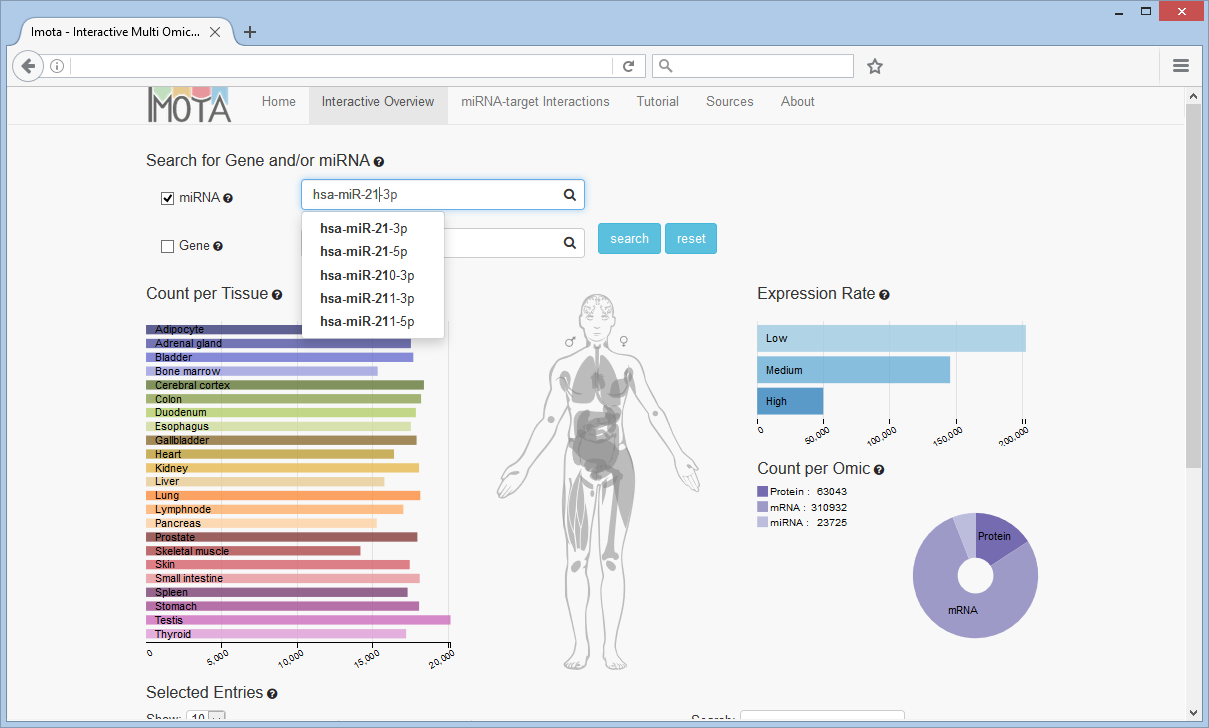
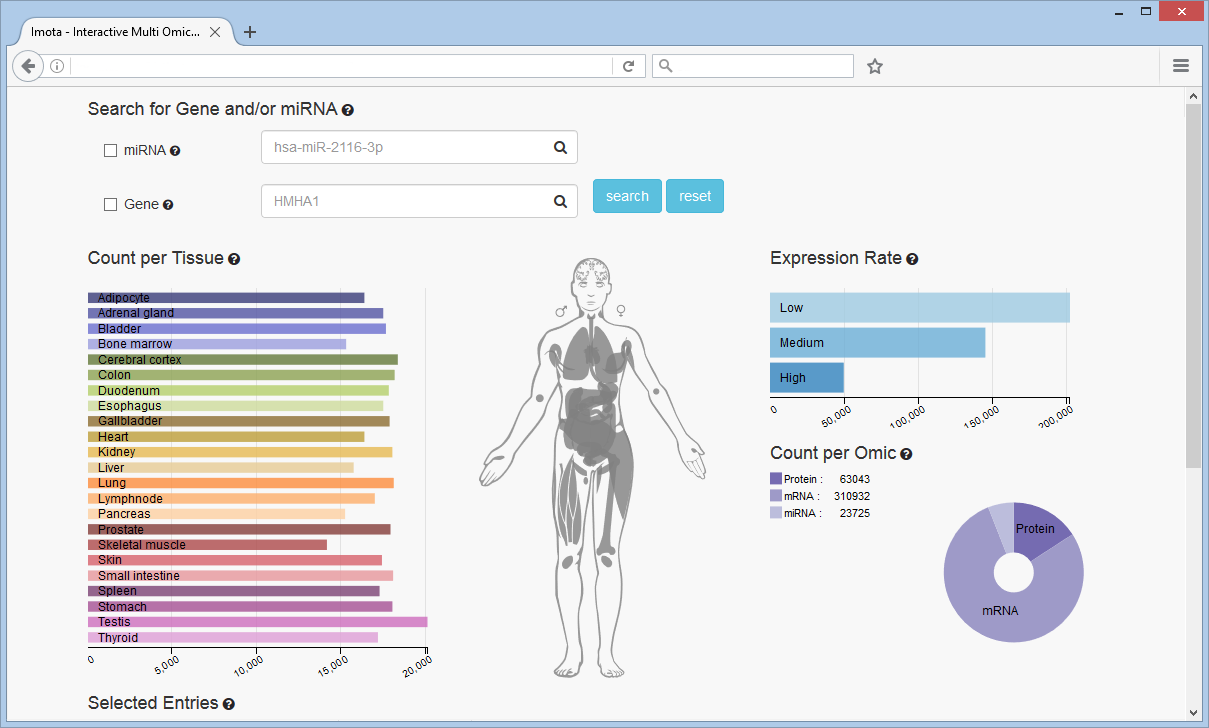
Search Gene and/or miRNA
Searching for a gene and/or miRNA will filter the data depending on the search input and display the information in the charts below.
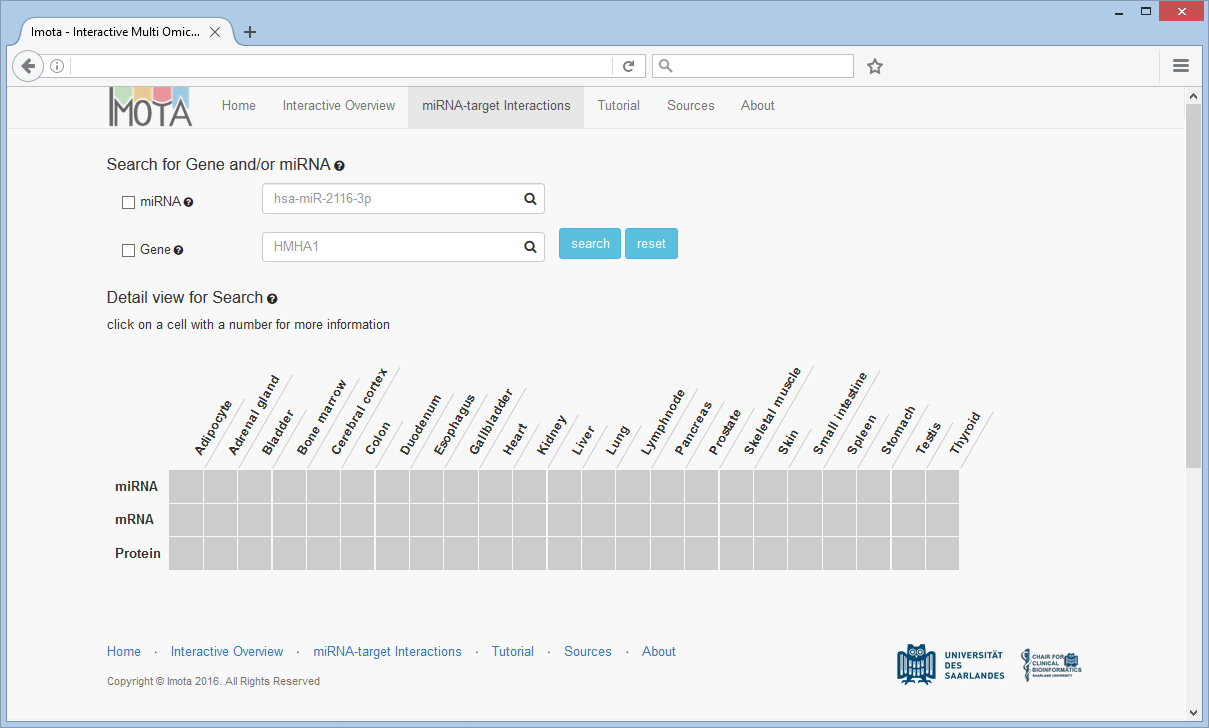
miRNA-target Interactions
The miRNA-target Interaction tab displays further information about target relations and evidence levels between miRNAs, mRNAs and Proteins.
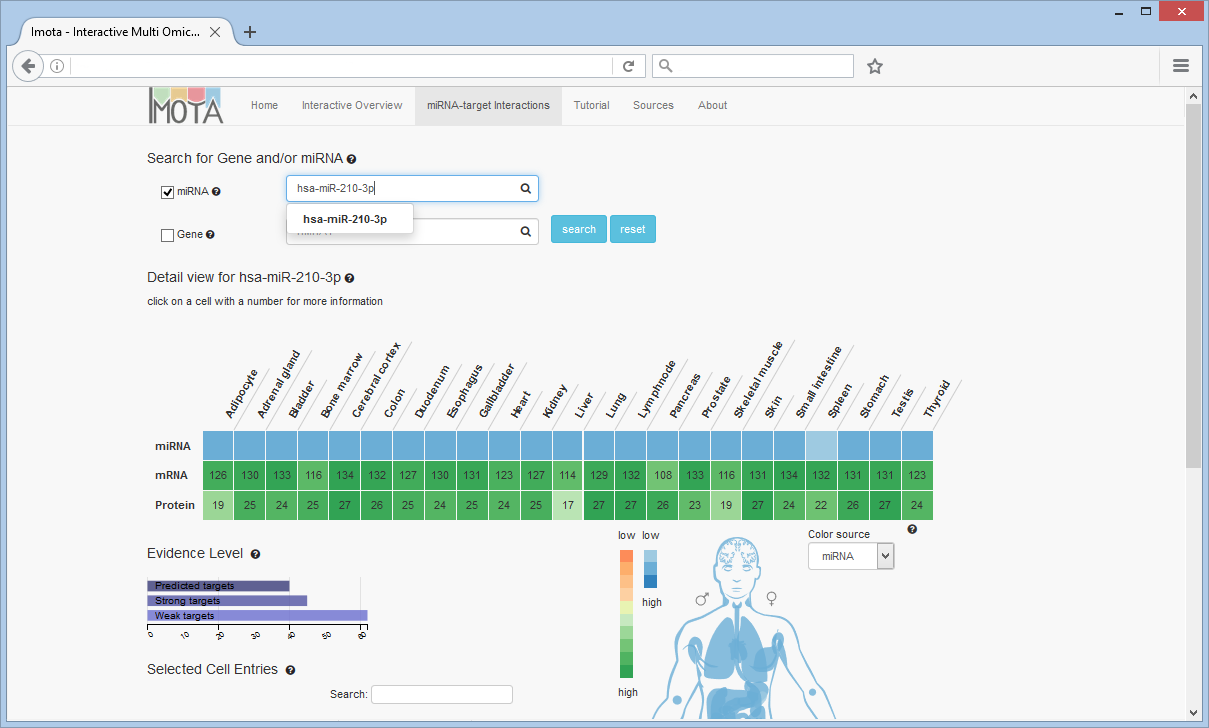
Search for miRNA
For example, a search for hsa-miR-210-3p reveals low to medium expression rates in all the tissues, which is shown in first row of the heat map as well as in the body visualisation. The number of target genes per tissue divided by omic type (mRNA, protein) is shown in the rows below.
Filter by Evidence
The Evidence Level bar chart displays the overall distribution of evidence levels for the displayed targets. To filter the heat map by evidence level click on the respective bar, e.g. 'Strong targets'.
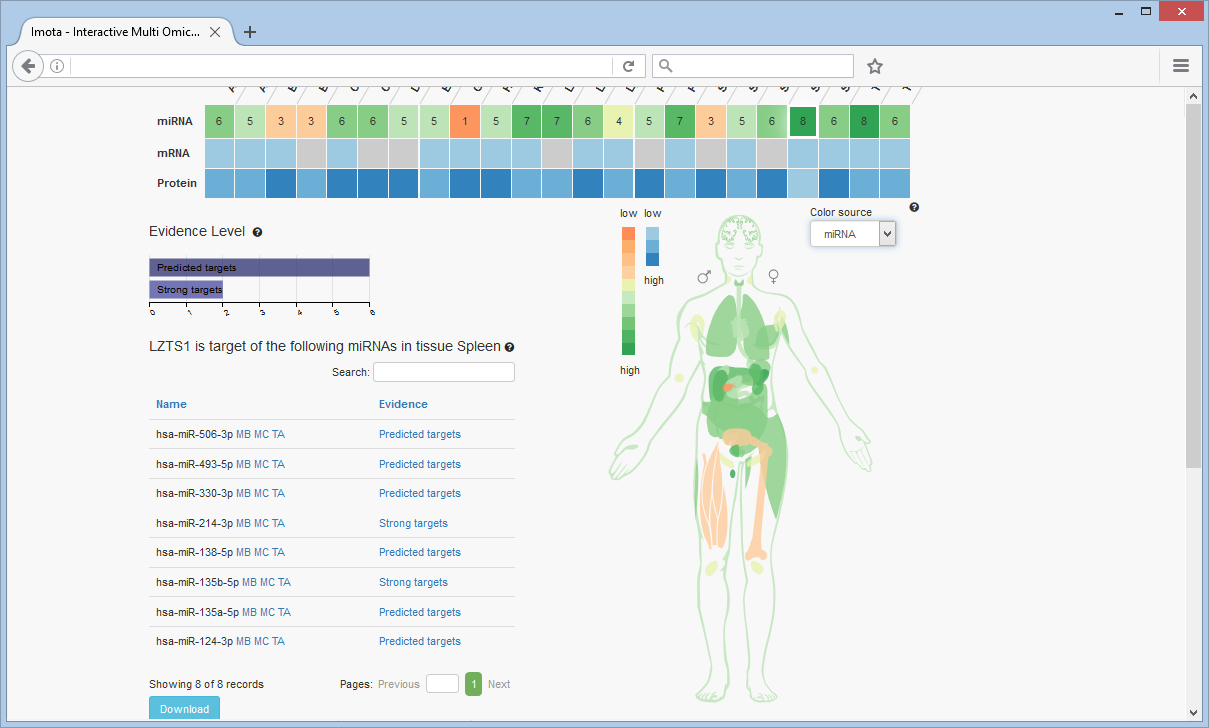
Body Visualisation
The colors of the tissues in the visualisation correspond to the colors of the heat map cells. The color source can be changed (miRNA, mRNA or protein)
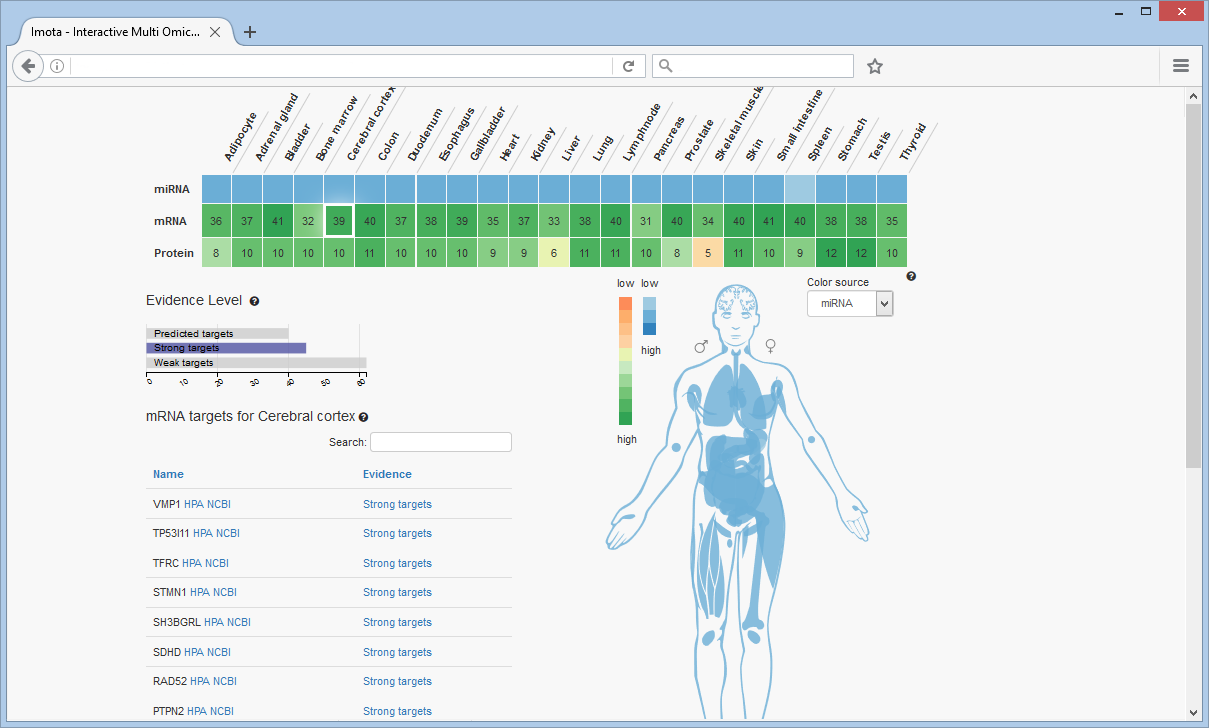
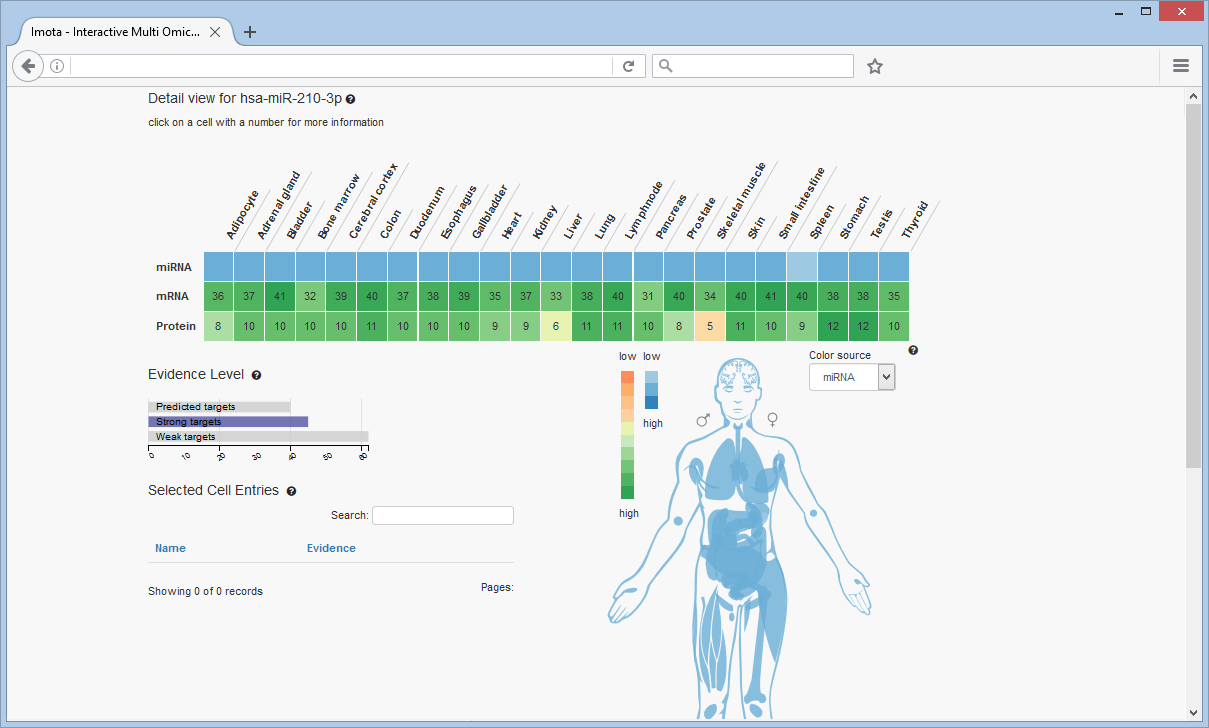
Targets of miRNA
Focusing on a specific tissue, e.g. cerebral cortex, is achieved by clicking on the respective cell (highlighted by a white rectangle). The corresponding targets are listed in the table.
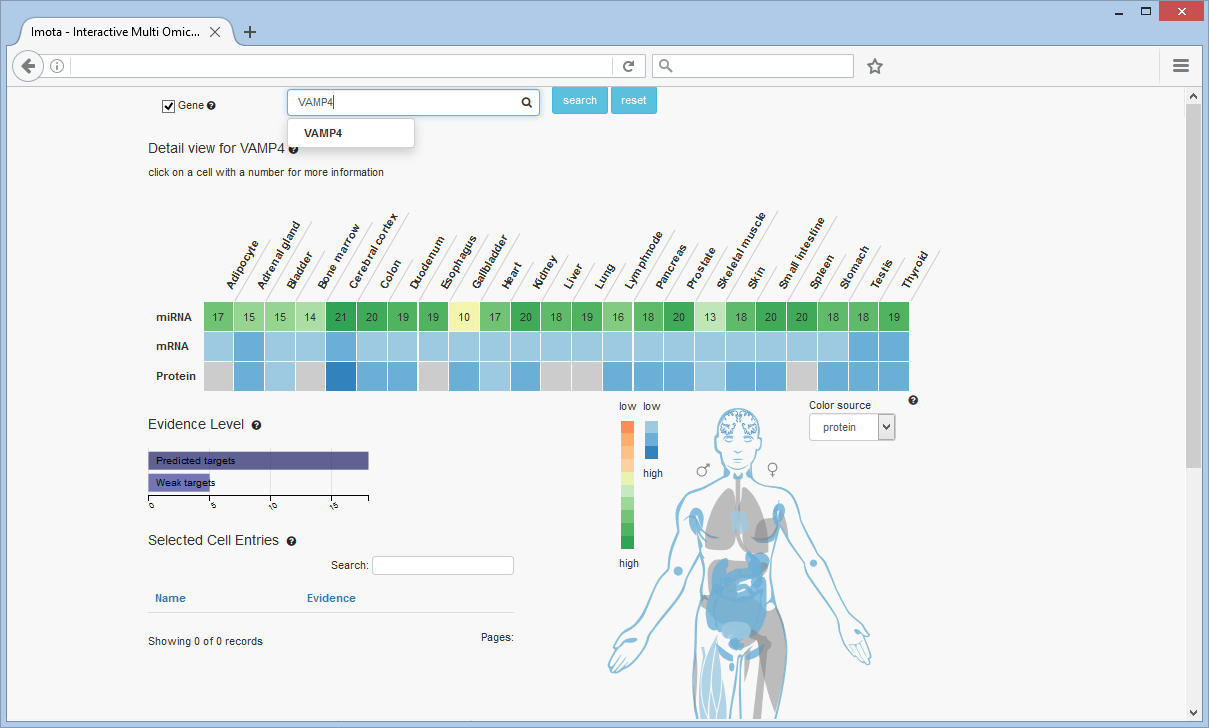
Search for Gene
Searching for the VAMP4 gene shows the number of miRNAs targeting this gene per tissue in the first row. The other rows are displaying the expression rates of the gene seperated by omic type (mRNA, protein) in the individual tissues. VAMP4 is not expressed in the adipocyte, bone marrow, esophagus, liver, lung and spleen tissues in the protein row.
Evidence Chart
The evidence chart again displays the overall evidence distribution of the miRNAs. In this example no 'Strong target' evidence is known.
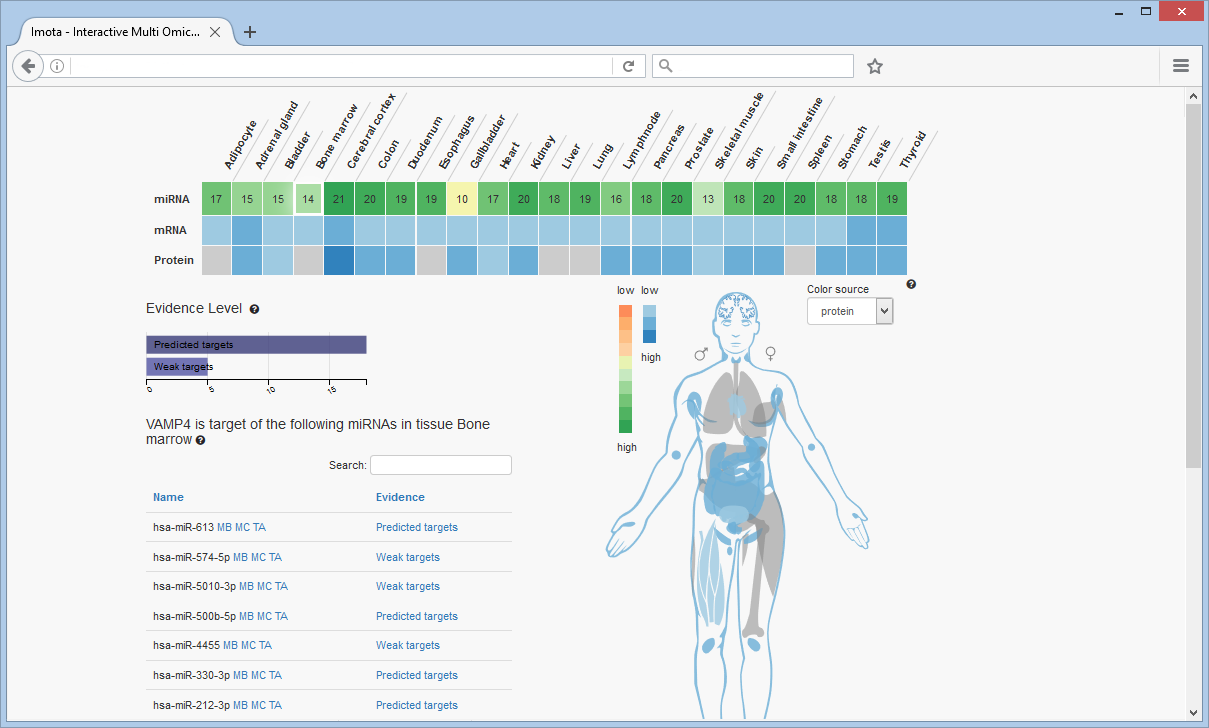
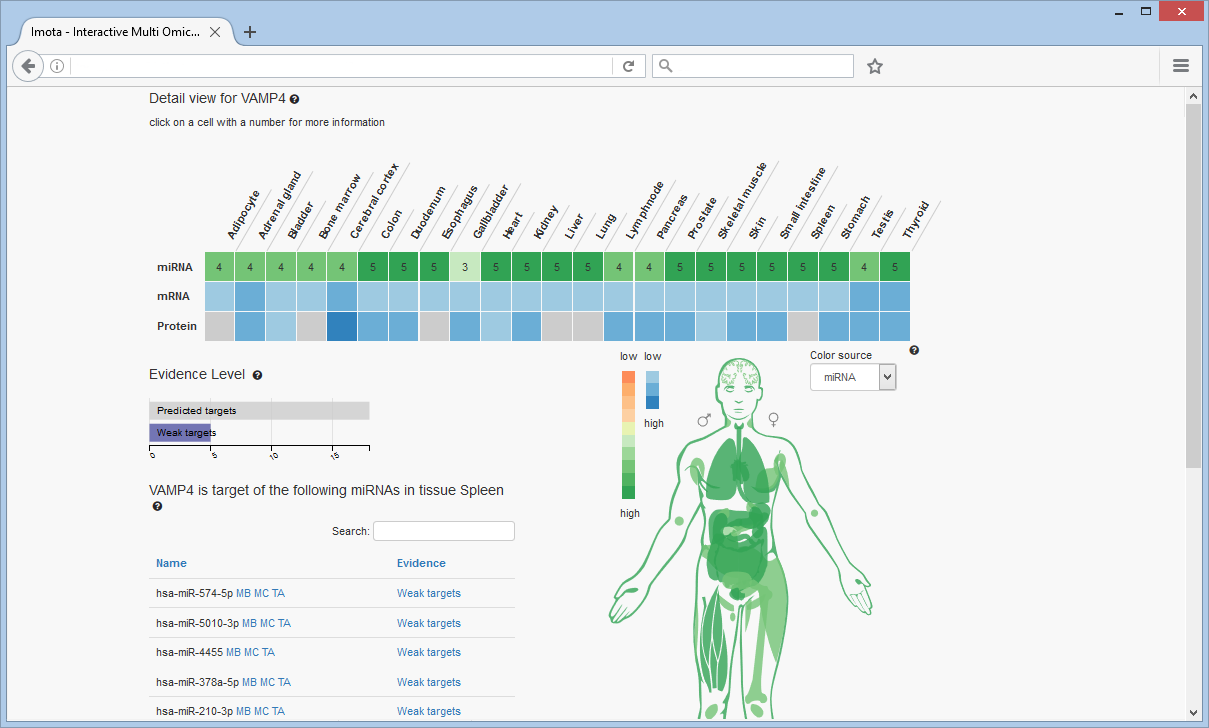
miRNAs targeting the gene
Analogous to the miRNA search exemplified before, selecting a numbered cell in the heat map, this time resulting from the gene search, will reveal the miRNAs targeting the VAMP4 gene.
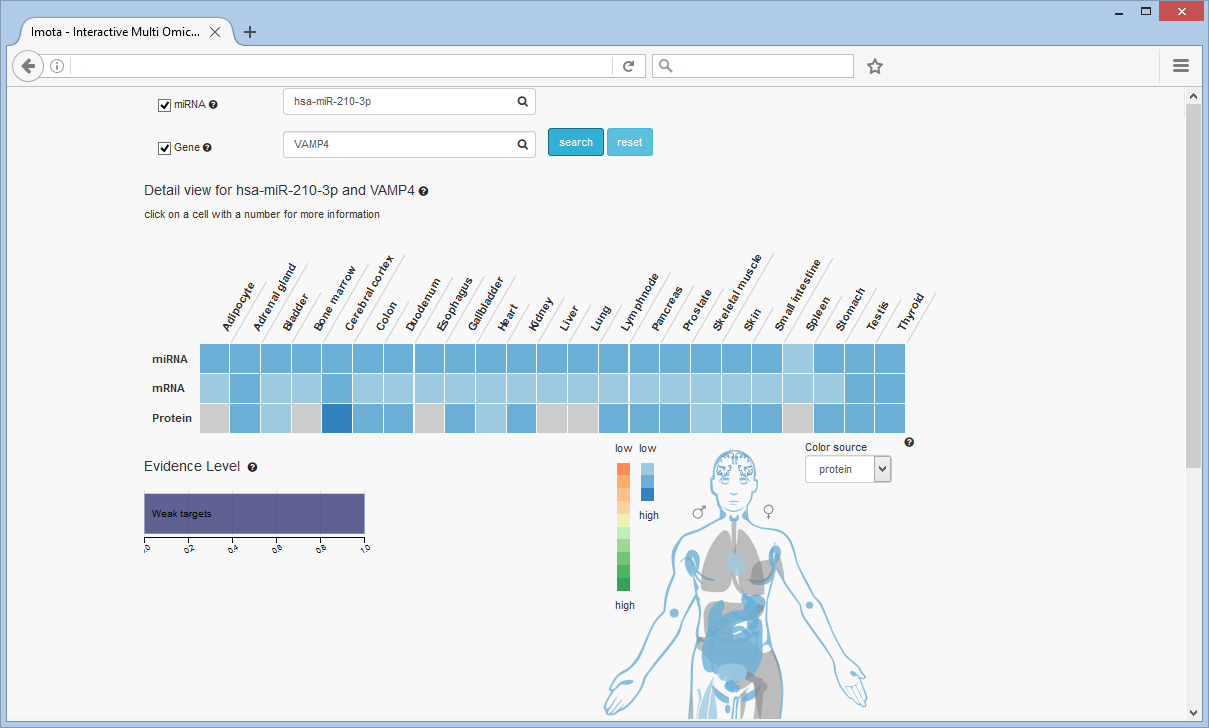
Search miRNA and Gene
A combined search for miRNA and gene is also possible, here at the examples of hsa-miR-210-3p and VAMP4. The heat map shows the expression rate for both of them. For the miRNA in the first row and for the mRNA and protein in the others. Only a weak target relationship between hsa-miR-210-3p and VAMP4 is known.